Proving the Cause-Effect Linkage
This article is a slightly modified chapter from the book Cumulative Impact and Other Disruption Claims in Construction, published in 2014.
1. INTRODUCTION
Contractors’ claim submittals and expert reports are often deficient in proving causation, i.e., the cause-effect linkage. These claims generally outline the owner-caused impacts and separately calculate quantum; however, the two are often not linked in any meaningful way. Most claims are settled prior to a decision by a panel, court, or board, and therefore these deficiencies are not made apparent. Yet, a well-prepared claim document that includes a persuasive and accurate cause and effect analysis can greatly improve the contractor’s chances of a successful recovery, either through negotiations or in arbitration/litigation. This analysis is difficult and often costly to prepare, and is therefore not performed in many disputes, which may be the reason why the claims fail.
For the analyst seeking to show the cause-effect linkage in a cumulative impact of changes claim, the task is even more difficult. By an earlier definition, cumulative impact is “exclusive of that local disruption that can be ascribed to a specific change,”1 or stated another way, cumulative impact cannot be ascribed to a specific change. Yet court and board decisions have shown that simply demonstrating that numerous changes existed, and that the contractor suffered a loss of productivity, is often not sufficient for recovery. This dichotomy is difficult to overcome.
In Luria Bros. & Co. v. United States, the court stated: “It is a rare case where loss of productivity can be proven by books and records; almost always it has to be proven by the opinion of expert witnesses.”2 Proving causation in direct disruption or cumulative disruption claims most often requires a qualified expert, as well as detailed and complete contemporaneous project documentation. The following suggestions, while case sensitive and highly dependent on the detail in the project record, provide several ideas on linking excessive changes with a loss of productivity:
This article is a slightly modified chapter from the book Cumulative Impact and Other Disruption Claims in Construction, published in 2014.
2. SCHEDULE ANALYSES
Contractors often utilize a schedule analysis to identify and help quantify the effects of owner-caused changes and impacts that delayed their work. As a result of project delay, the contractor may accelerate, increase its manpower, work excessive overtime, experience trade stacking and crowded conditions, and allege compensable loss of labor productivity. However, without support from a schedule analysis, the contractor makes a quantum leap from proving the owner-caused delays and impacts, to alleging that 100 percent of the productivity loss is compensable due solely to the owner-caused delays and impacts.
The contractor’s own problems may have contributed to the productivity loss and must be considered. A more appropriate cause and effect analysis of the increased labor costs would be to allocate the labor cost increases to both the owner and the contractor according to their respective share of delays, disruptions, and problems.
Contractors are not legally bound to demonstrate delayed performance or project delay to recover for loss of productivity.3 However, the relationship between delay and productivity is evident. If a contractor is delayed, it may have to recover that delay through acceleration measures, at the expense of productivity. Likewise, if a contractor suffers poor productivity, it may lead to schedule delay.
When courts and boards are considering causation in respect of disruption claims, the proof of delay, or lack thereof, is at least one consideration. In Charles G. Williams Construction, the board found that the contractor had proven it was delayed unreasonably by the government’s actions, and therefore the contractor was entitled to damages for both extended overhead and disruption.4 In discussing proof of causation in J. A. Jones, the board emphasized that the contractor had not proven it was delayed as a result of compensable issues, which was one basis for its denying the contractor’s cumulative impact claim.5 In Advanced Engineering & Planning Corp., the board, in denying the contractor’s disruption claim for lack of causation, cited the contractor’s failure to use a resource-loaded CPM schedule as required by contract:
In this connection, we have found, had it submitted and updated a “resource loaded” CPM as required by Standard Item No. 009-60, AEPCO could have tracked disruptive impact through the schedule…6
Based upon the above, it is evident that a construction schedule analysis can be helpful in demonstrating the cause-effect linkage. Even if a formal schedule analysis is not prepared, bar charts, histograms, and other data sourced from the project schedule can be useful in demonstrating causation. Several examples of this are provided in this chapter.
3. TRACKING IMPACTS BY ACTIVITY OR CREW
One definition of cumulative impact is when work on one activity is adversely affected by another activity, or by the mere nature of the site environment.7
In a claim submittal, it can be effective to demonstrate the impacts affecting one activity or a group of activities. After that impact is established, one may be able to show the “ripple,” or the impacted activities’ negative effect on other activities. For example, with detailed project documentation, the following description could be provided:
The work on pipeline 2A01 was planned to take 10 work days, but it actually took 30 work days. In that period, five RFIs were issued requesting clarification on design discrepancies. The owner took on average four days to respond. The owner issued Rev 2 isometric drawings on September 3rd, ten days after work had commenced, which led to rework. Further, owner-supplied valves were late and much of the pipe could not be installed until the valves were set. As shown in the daily reports, there were constant interruptions to the work…
From the project schedules, one could then determine which activities ran concurrently with this activity, and which activities were its logical successors. The changes on pipeline 2A01 may have impacted these successor activities as well. If the above description of the impacts to pipeline 2A01 included “work delayed by open excavation of under-ground pipe for 2B18,” the theoretical “ripple” becomes real.
Even though the work described may be a small percentage of the total scope, providing just a few such examples begins to demonstrate cumulative impact. The next step, per the definition above, is showing how the overall site environment was impacted.
4. SITE ENVIRONMENT CHANGES
Changes to the site environment can be any difference in the way work was actually performed, compared to the way it was planned to be performed. Both MCAA and Leonard provide typical causes of lost productivity, which could also be considered site environment changes. Leonard provided the following description:
Cumulatively, change orders result in the following causes of productivity loss: stop-and‑go operations; out‑of‑sequence work; loss in productive rhythm; demotivation of work force; loss in learning curve; unbalanced crews; excessive manpower fluctuations; unbalancing of successive operations; lack of management and engineering support; and acceleration when equitable time extensions are not granted.8
The cause-effect linkage is shown by proving that these conditions existed. The contractor’s best case can be made if these impacts are recorded contemporaneously, such as in daily reports. Assuming there is no such record, a few examples of analyses that might be performed to demonstrate this proof are discussed below:
Out-of-Sequence Work: A comparison could be made of the contractor’s as-planned and as-built schedules, showing which activities were performed out-of-sequence from plan. One could review the causes of this sequence change and show a detailed list of activities that were impacted due to changes.
Using the same comparison, one could review concurrent activities in the planned schedule compared to those in the as-built schedule. If only four piping activities were planned to run concurrently, but the as-built schedule shows that ten piping activities ran concurrently, this may help prove productivity loss. This analysis would correspond to the MCAA factor “Concurrent Operations.”9
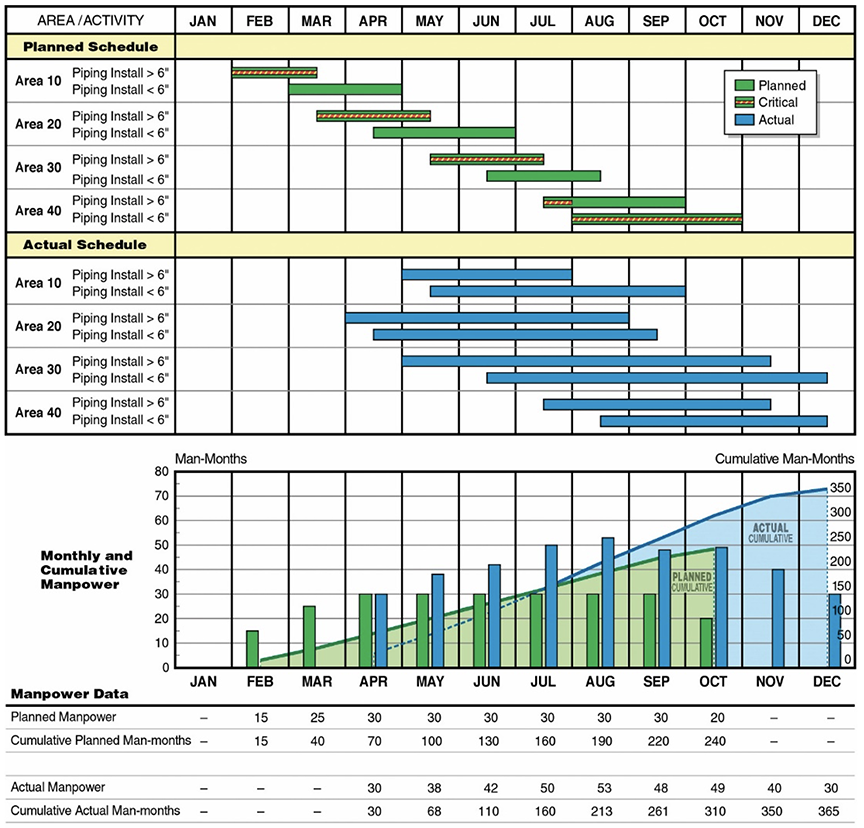
In Figure 1 below, for example, the planned schedule shows the contractor anticipated that piping work would proceed through the four areas with very little concurrent work. Due to late design and site access issues, the work started late and out-of-sequence, and the contractor actually performed work in three or four areas simultaneously.
Figure 1: Bar Chart Schedule and Manpower Comparisons
Demotivation of Work Force: From human resources and cost records, one could calculate the absenteeism and turnover rates on the project and compare them with other similar projects that were not as severely impacted by changes. If the increased absenteeism and turnover occurred during the same period as did the owner-caused impacts, the cause-effect relationship may be justified.
Loss in Learning Curve: One could make a comparison between the planned peak manpower and the actual peak manpower, and potentially show that the timing of additional forces corresponded to the timing of change order work. Were the added workers craftsmen or laborers, and what was the impact? How much time was lost by new labor crews learning the remaining scope of work, availability and location of tools and equipment, location of materials, project specific construction procedures, etc.? In Figure 1, the contractor planned to complete the work utilizing 30 workers, but actually used 53 workers at the peak. It is likely that the addition of 23 workers led to loss of productivity.
These are the types of analyses that fill the gap between numerous change orders and a large overrun on labor costs. Providing these or similar cause and effect analyses to the court may take some of the subjectivity out of its decision.
5. TELL THE FACTUAL STORY WITH GRAPHICS
Dozens of pages of narrative can be effectively summarized in one graphic, or to put it another way, a picture’s worth a thousand words. Including interesting and factual graphics in a claim submittal grabs the reader’s attention and focuses that attention on one’s argument.
More importantly, graphics similar to the examples provided in this chapter have been shown to be persuasive to the trier of fact evaluating disruption claims. In awarding the contractor disruption damages in P.J. Dick, the board considered the productivity expert’s timelines, which compared the contractor’s actual man-hours with the alleged project impacts.10 In Bell BCI Company, the court found a graphic showing the contractor’s earned and unearned man-hours by month to be “instructive,” as it demonstrated that most of the contractor’s inefficiency occurred after a major project change was introduced.11 The court awarded the contractor damages for cumulative impact.
In respect of cumulative impact claims, graphics can also be effective in demonstrating the quantity, timing and magnitude of the changes. Figure 2 below, for example, a graphical example of tracking impacts by activity (as discussed in Section 2 above), shows the quantity and timing of the Design Change Notices that impacted a given scope of work.
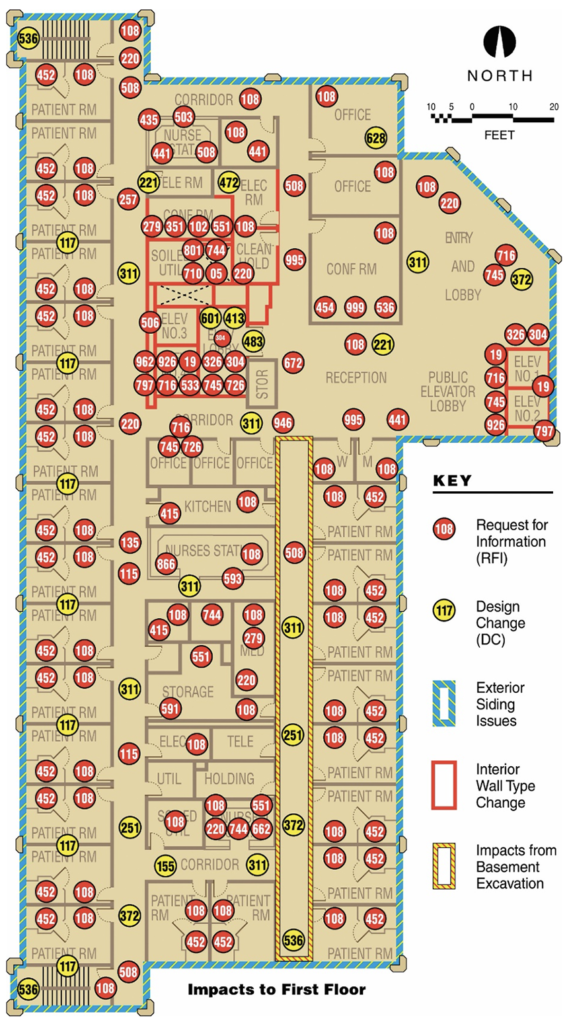
Another demonstrative graphic of impacts is shown by Figure 3 below, which plots the location of various types of impacts on the plan view of a hospital building. This “Measles Chart” tells the story that the design problems which disrupted the construction contractor’s work were significant, and logically had to have a ripple effect on its labor productivity. The same chart could be reproduced in monthly intervals to demonstrate the timing of the introduced changes, and that work was impacted over a significant period.
Figure 2: Example of Tracking Impacts by Activity
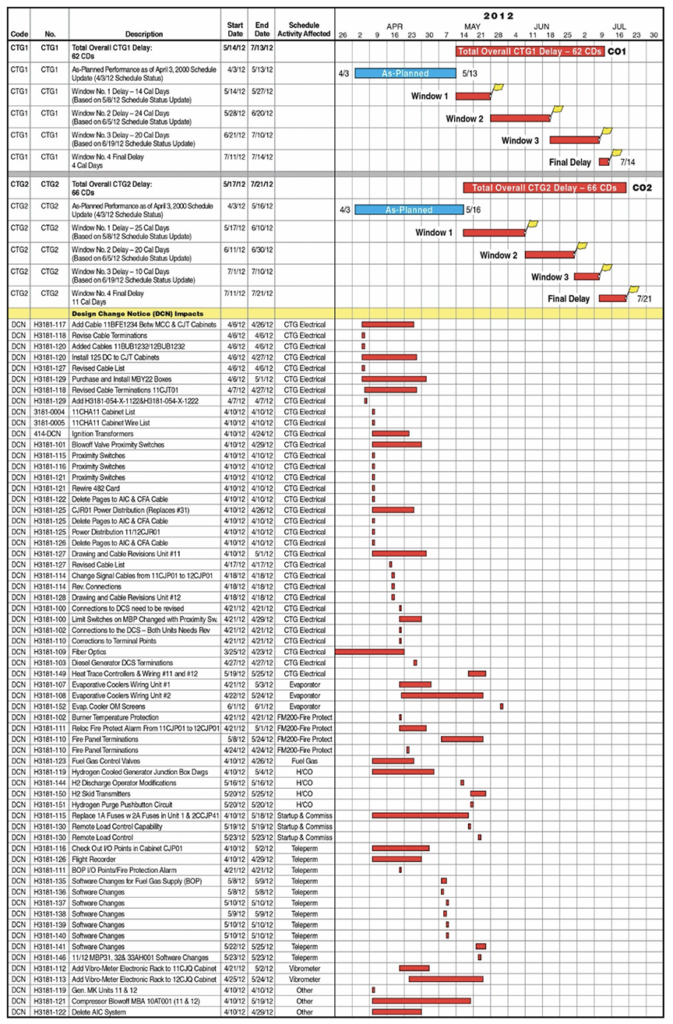
Figure 3: Multiple Impacts to a Project
6. THE CAUSE-EFFECT MATRIX
The backbone of the cause and effect linkage in any construction claim is the cause-effect matrix. For any given owner-caused problem, one can graphically trace the effects to the contractor’s work. Figure 4 displays simple cause-effect matrices. The first matrix shows that a single problem, defective specifications, results in hydrostatic test failures. The second matrix has three initial causes, two intermediate effects, and two resulting problems.
Figure 4: Simple Cause-Effect Matrices
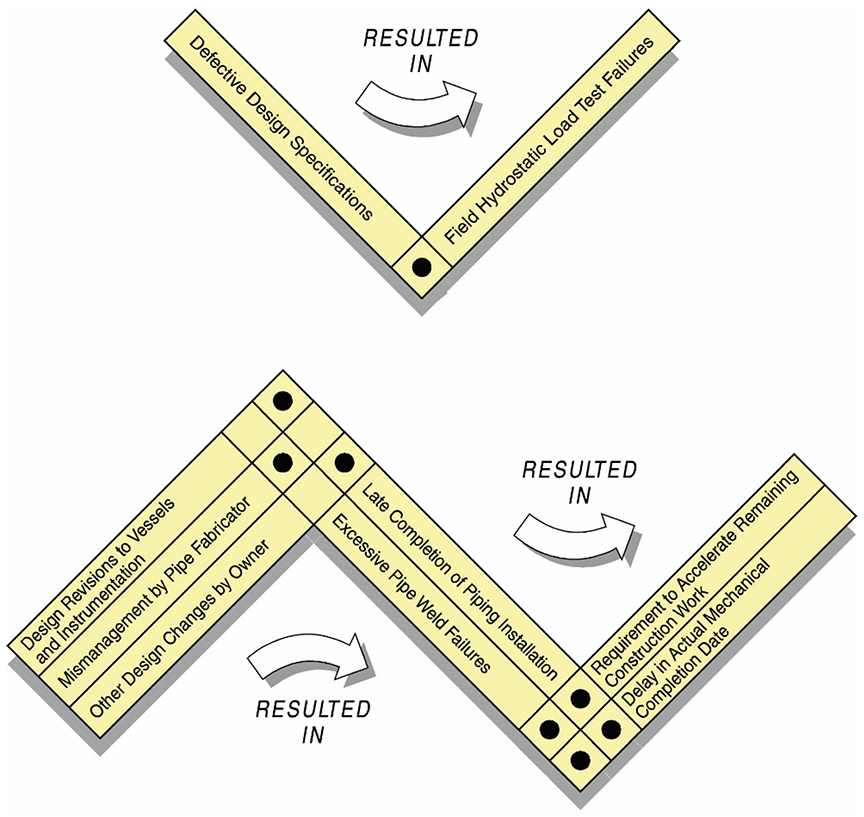
As multiple causes and their resultant effects are added, the matrix ultimately becomes much more complicated. Figure 5 shows a typical cause-effect matrix for a highly impacted project. Primary and secondary causes, including contractor-caused problems, are shown to have multiple and duplicative effects, with the end result being a cost overrun. Even though it is complex, Figure 5 can still be broken down into the same types of simple relationships that are shown in Figure 4.
Figure 5: Typical Cause-Effect Matrix for a Delay/Disruption Construction Claim
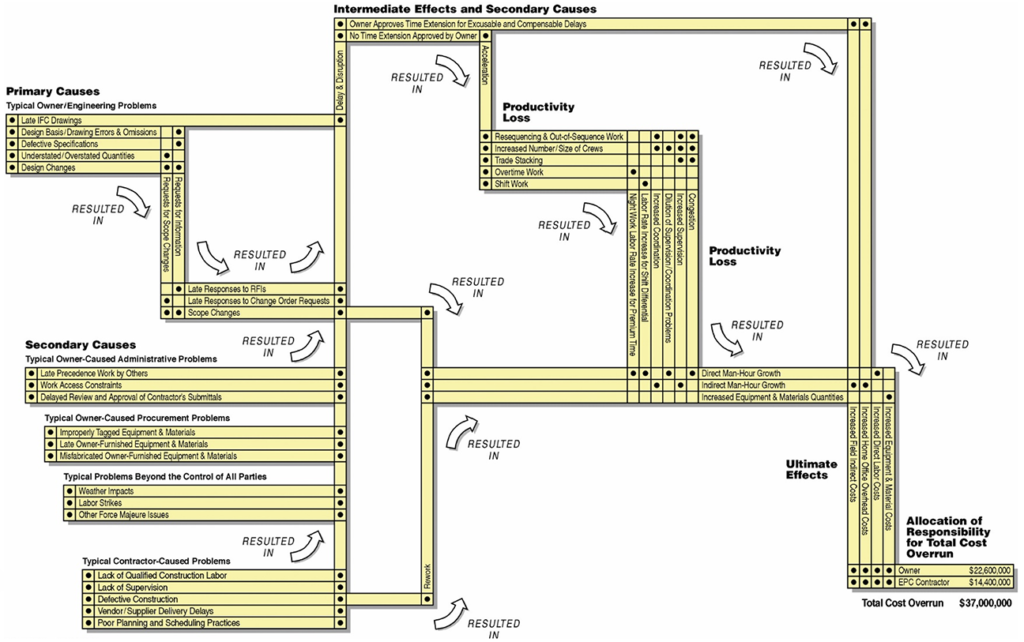
Tracing one path through this cause-effect matrix tells a factual story: design changes resulted in the contractor requesting scope changes; the owner was late in responding to many change order requests, which resulted in delay and disruption; the owner did not approve the proper time extensions, which resulted in the contractor accelerating its work; and the acceleration caused trade stacking and congestion, which led to direct man-hour growth and increased direct labor costs, a portion of which are being claimed against the owner. Each of the causes has a similar factual story, the ultimate effect being increased costs.
Showing these relationships graphically, in addition to a narrative containing relevant excerpts from contemporaneous documents, provides the contractor, the owner, the attorneys, and the arbitration panel or court a better understanding of all the impacts on the project. A similar but more detailed graphic could be prepared showing the effects of several change orders during a given time period to help support a claim for disruption.
About the Authors
Richard J. Long, P.E., P.Eng., is Founder of Long International, Inc. Mr. Long has over 50 years of U.S. and international engineering, construction, and management consulting experience involving construction contract disputes analysis and resolution, arbitration and litigation support and expert testimony, project management, engineering and construction management, cost and schedule control, and process engineering. As an internationally recognized expert in the analysis and resolution of complex construction disputes for over 35 years, Mr. Long has served as the lead expert on over 300 projects having claims ranging in size from US$100,000 to over US$2 billion. He has presented and published numerous articles on the subjects of claims analysis, entitlement issues, CPM schedule and damages analyses, and claims prevention. Mr. Long earned a B.S. in Chemical Engineering from the University of Pittsburgh in 1970 and an M.S. in Chemical and Petroleum Refining Engineering from the Colorado School of Mines in 1974. Mr. Long is based in Littleton, Colorado and can be contacted at rlong@long-intl.com and (303) 972-2443.
Rod C. Carter, CCP, PSP, is President of Long International, Inc. He has over 20 years of experience in construction project controls, contract disputes and resolution, mediation/arbitration support, and litigation support for expert testimony. He has experience in entitlement, schedule, and damages analyses on over 30 construction disputes ranging in value from US$100,000 to US$7 billion, related to oil and gas, heavy civil, nuclear, environmental, chemical, power, industrial, commercial, and residential construction projects. He is proficient in the use of Primavera Project Planner software and has extensive experience in assessing the schedule impact of RFIs, change orders, and other events to engineering and construction works. Mr. Carter specializes in loss of productivity, cumulative impact, and quantum calculations, and has held a lead role in assessing damages on more than a dozen major disputes. In addition, Mr. Carter has developed cost and schedule risk analysis models using Monte Carlo simulations to address the uncertainty of estimates and claims. He has testified as an expert in construction scheduling and damages and has presented expert findings to an international arbitral tribunal. Mr. Carter earned a B.S. in Civil Engineering from the University of Colorado at Boulder in 1996, with an emphasis in Structural Engineering and Construction Management. Mr. Carter is based in Littleton, Colorado, and can be contacted at rcarter@long-intl.com and (303) 463-5587.
Harold E. Buddemeyer, Jr., was a Senior Principal for Long International and passed in January 2022. He had nearly 50 years of experience in all aspects of program and construction project management and construction disputes. His experience included construction and property damage/business interruption claims analysis, preparation, defense, and negotiation of settlements on projects including refineries, offshore oil and gas, petrochemical plants, heavy civil and mining projects, oil sands facilities, nuclear, coal and gas-fired power plants, and building projects. Mr. Buddemeyer’s project experience included project cost/schedule control, systems and procedures development and implementation, program planning, as well as capital and operating cost estimating and economic analysis during the design, construction, and start-up phases of a diverse cross section of projects. Mr. Buddemeyer had over 34 years of construction contract disputes consulting experience. In this regard, he was responsible for entitlement and issue analysis; change order analysis; labor productivity analysis; cost and damages analysis; schedule delay and impact analysis; claim report preparation and rebuttal; negotiation and mediation assistance; the organization, development and maintenance of document databases; assistance to counsel during discovery; and depositions and interrogatory preparation. Mr. Buddemeyer testified in U.S. and international arbitration. For further information, please contact Long International’s corporate office at (303) 972-2443.
1 Centex Bateson Constr. Co., VABCA Nos. 4613, 5162, 5165, 99-1 BCA, 30,153 (1998), aff’d, Centex Bateson Constr. Co. v. West, 250 F.3rd 761 (Fed Cir. 2000) at 149,258 (citing Triple “A” South, 94-3 BCA, 27,194, ASBCA No. 46,866 (1994) at 135,523).
2 Luria Bros. & Co. v. U.S., 177 Ct. Cl. 676, 369 F.2d 701, 713 (1966) at 713.
3 See “Estimating Lost Labor Productivity In Construction Claims,” AACE International Recommended Practice No. 25R-03, April 13, 2004, p. 6.
4 See Charles G. Williams Constr., Inc., ASBCA No. 33766, 89-2 BCA, 21,733 (1989).
5 See J. A. Jones Construction Co., 00-2 BCA, 31,000, ENGBCA Nos. 6390-1, 6386-7, 6348, 6388-9, 2000 WL 1014011 at p. 48.
6 Advanced Engineering & Planning Corp., ASBCA Nos. 53366, 54044, November 2004, at 104.
7 See Robert F. Cushman, Stephen D. Butler, & James F. Nagle, Construction Change Order Claims, Wiley Law Publications, § 4.11 (1998 Supplement).
8 Charles A. Leonard, “The Effects of Change Orders on Productivity,” M.S. Thesis at Concordia University, 1988, p. 121.
9 See “Change Orders Productivity Overtime – A Primer for the Construction Industry,” MCAA, 2012, p. 77.
10 See P.J. Dick, Inc., 01-2 BCA, 31,647, VABCA Nos. 5840-5850, 5951-5959, and 6017-6024 (2001), at pp. 34–35 (Westlaw print).
11 See Bell BCI Co. v. United States, No. 03-1613C, 81 Fed. Cl. 617, 2008 U.S. Claims LEXIS 116 (April 2008), at pp. 19–20.
Copyright © Long International, Inc.
ADDITIONAL RESOURCES

Articles
Articles by our engineering and construction claims experts cover topics ranging from acceleration to why claims occur.
MORE

Blog
Discover industry insights on construction disputes and claims, project management, risk analysis, and more.
MORE

Publications
We are committed to sharing industry knowledge through publication of our books and presentations.
MORE

