Schedule Optimization in FEED Project Management
This paper summarizes the development and review steps of project plans and schedules during the front-end planning phases, including the critical phase of Front-End Engineering Design (FEED).
ABSTRACT
Poor planning is a significant factor leading to project failure. If a project does not start right, it is unlikely that it will end right. Project management teams must be equipped and actively engaged with cost-effective tools to plan, monitor, control, document, and analyze changes to manage projects effectively. This is particularly true in a post-pandemic era when subject matter experts may be only remotely available to support project teams.
This paper summarizes the development and review steps of project plans and schedules during the front-end planning phases, including the critical phase of Front-End Engineering Design (FEED). The project milestones, resources, and completion dates established during FEED set the baseline control plan during project execution. Therefore, EPC schedule optimization techniques, including using the DCMA 14‑point schedule assessment and other quality checks, are recommended to validate that a project baseline is reasonably achievable. The tools and techniques presented here apply to all capital projects.
1. INTRODUCTION
Planning is more of an art than a science, particularly during the pre-project planning phase, when scheduling logic is more preferential than mandatory. There seems to be no right or wrong answer, as every project is unique, even compared to a similar project completed by the same company. The process of planning and scheduling a project is like a journey. It is important not only to meet goals but also to enjoy the trip. A scheduler is constantly challenged and rewarded along this journey. It feels good to finish a deadline—only to face another afterward. The journey may take one to new cities and continents as the project moves from one stage to another. This affects a project team and its dependents. People may need to relocate temporarily, face cultural challenges, meet new and interesting people, and ask loved ones to tolerate temporary family separation.
This paper provides a holistic guide for capital project planning and scheduling. The methods and strategies used in this paper reflect practical front-end schedule optimization tools and techniques that have helped project managers and their teams think through entire projects in detail and build roadmaps to validate project schedules and milestones developed prior to the project execution phase. Best-in-class owners and contracting companies often use the modified version of the DCMA 14-point schedule quality checks summarized in this paper in front-end planning practices. The paper also capitalizes on best practices by prestigious industry benchmarking and construction research and industry organizations such as Independent Project Analysis (IPA), the Construction Industry Institute™ (CII), the Project Management Institute (PMI)®, and the Association for the Advancement of Cost Engineering, AACE International® (AACE). Most best-in-class companies or their project teams are sustaining members of these organizations. Many of them have adapted their in-house project management-related methods and procedures for managing front-end project planning.
2. SCHEDULING QUALITY ASSURANCE (QA)
Many EPC project schedules are poorly prepared and require extensive re-baselining during project execution to become useful project management tools to correctly measure progress, determine the effect of changes in scope, and forecast the completion of contractual milestones and overall project completion dates.1 Poorly prepared schedules do not provide reliable tools to quantify and allocate responsibility for delays during project execution to provide a basis for a time extension or assess the need for acceleration to mitigate delays. This paper discusses procedures to rectify these common problems with project schedules, including ensuring that a schedule accurately reflects the complete contractual scope of work, evaluating schedule metrics to assess schedule integrity, reviewing schedule logic for reasonableness, evaluating reasonableness and completeness of the critical path, and comparing a schedule to the baseline or previous updates to identify significant changes.
A schedule quality survey provides valuable and comprehensive project schedule checks to ensure that: the complete scope of work is represented; schedule metrics are within industry norms; schedule logic is reasonable and competitive; and the project critical path is reasonable and achievable. Compiled findings from these examinations serve as a guide for schedule improvement.
3. SCHEDULE QUALITY CHECKS DURING THE PROJECT LIFE CYCLE
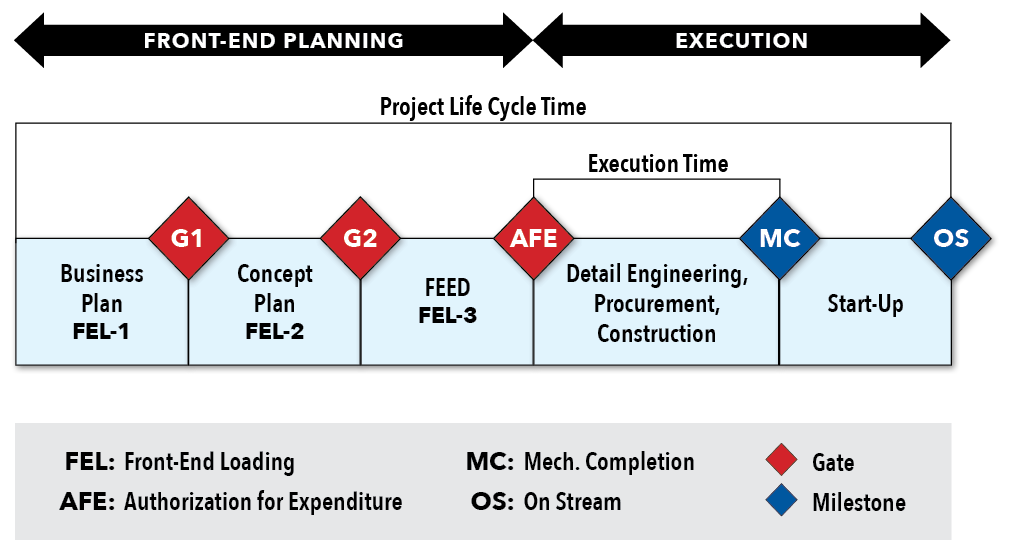
A project life cycle refers to the several phases and stages that a project passes through from initiation to completion. Major capital projects consist of two phases of pre-planning and execution. Each phase consists of stages marked by defined activities that correspond to project scope and deliverables. Approving the deliverables that are normally marked by a gated milestone manifests completion of each stage. Decision gates are critical checkpoints when phase deliverables receive formal review and approval, allowing a project to move to the next stage or phase. This includes the project’s financial approval with authorization for expenditure (AFE).
Figure 1 shows a typical capital project’s planning and execution roadmap showing the phases and stages of the project life cycle. Each stage has specific objectives, defined activities, deliverables, and decisions. Decision gates may be formal or informal, depending on the organization. The stages of the pre-planning phase are also referred to as Front-End Loading (FEL). IPA, a global consultancy in project evaluation and project system benchmarking, defines FEL as “the process by which a company develops a detailed definition of a project that was initiated to enable the company to meet its business objectives.”2 IPA research has shown that project definition, or FEL, is one of the most significant drivers of project success. Edward Merrow, Founder and CEO of IPA, states that FEL is usually formatted into three stages:3
- Business Case Development,
- Scope Development, and
- Front End Engineering Design (FEED)
At the end of the FEED phase, project funding is approved, and a project can move forward and be awarded for engineering, procurement, and construction (EPC) execution. The type of execution depends on the contracting strategies established during the pre-planning phase.
Figure 1 – A Typical Capital Project’s Planning and Execution Roadmap
CII states that project planning is often synonymous with Front-End Planning (FEP) and FEL: “Project Planning is often synonymous with front end planning (FEP), front end engineering design (FEED), front end loading (FEL), pre-project planning (PPP), feasibility analysis, programming and conceptual planning.”4 The FEL process organizes the project life cycle into different phases, decision gates, or checkpoints to help management decide if a project is ready to continue to the next phase. According to CII, FEP is “the process of developing sufficient strategic information with which owners and contractors can address risk and decide to commit resources to maximize the chance for a successful project.”5 Well-performed FEP can reduce cost and project variability and increase chances of a project meeting its objectives. Front end planning is arguably the single most important process in the facility project life cycle.6
Figure 2 shows the three stages of FEP, cost/schedule deliverables, expected outcome, and decision gates at each stage. FEL 1, 2, and 3 engineering phases present an excellent opportunity to apply robust planning early in a project’s life cycle, when the ability to influence changes in design is relatively high and the cost to make those changes is relatively low. They typically apply to industries with highly capital-intensive projects with long life cycles.
Figure 2 – FEP Phases and Their Expected Outcomes

The next section discusses recommended schedule quality checks at each stage of FEP. It is encouraged that schedule reviewers be included as part of gate reviews and score each of the checklists presented in the following few sections, marking “pass,” “fail,” or “need improvement” on the project schedule. If there are any failed items, the schedule should not be accepted until errors are corrected.
4. QUALITY CHECKS DURING BUSINESS PLAN DEVELOPMENT (FEL-1)
The business plan stage is often referred to as the project initiation stage. Figure 3 shows major activities and deliverables during the business plan stage.
Figure 3 – Major Activities/Deliverables During the Business Plan Stage

Major activities include conducting a business case, preliminary conceptual studies, scope definition, stakeholders’ identification, and benchmarking against similar internal or external projects. Major deliverables include a project charter, project scoping paper, business plan schedule, Level I master schedule, and +/‒ 50% accuracy estimate. A business plan must include a preliminary description of the facilities planned to be built, defined in sufficient detail to develop a capital budget cost estimate, as well as a Level I master schedule.
4.1 Business Plan Level I Master Schedule
A business plan project schedule reflects the business plan milestones usually presented in a bar-chart format during FEL-1. It is developed mainly based on a brief scope of work and historical data. It also takes into account local and market conditions and other supporting data. The Level I master schedule is prepared based on preliminary durations during a project’s initial development using historical project durations benchmarked against similar projects in an organization or from outside the organization. This schedule identifies preliminary durations for project life cycle phases. A business plan project schedule should include activities for each of the following:
- Overall duration for FEL-1, FEL-2, and FEL-3
- All the relevant gate approvals such as Gate 1 through Gate 3 as milestones
- EPC execution contract bidding duration
- Business plan cost estimate and AFE activities
- EPC execution contract award milestones
- Overall duration for detailed engineering design
- Overall duration for material and equipment procurement
- Overall duration for construction up to Mechanical Completion (MC)
- Commissioning and startup activities
- Pre-funding summary duration from FEL-1 to AFE
- Post-funding summary duration from AFE to project completion
Figure 4 – Example of a Business Plan Schedule for a Large Process Plant Project

The following schedule optimization checklist provides the minimum quality measures one should include with a Level I project master and business plan schedule:
- Brief scope of work or project scoping documents
- Initial project charter
- Initial contracting strategy
- Preliminary list of major equipment including long-lead equipment
- Estimated preliminary major installation quantities
- List of key interfaces within the project or with other projects
- Schedule data used as benchmarks from similar projects
- Conceptual drawings of the facility including site plan
- Preliminary vendor quotations if available
- Shutdown and startup requirements and/or sequences
5. QUALITY CHECKS DURING CONCEPTUAL PLAN DEVELOPMENT (FEL-2)
The conceptual stage (FEL-2) should include a complete scope of the capital project to achieve economically the stated business objective(s). This stage is also known as the facility plan as it defines the design basis prior to initiating FEED development. FEL-2 should define the major design aspects of the project and detail the impact on existing or future facilities. It also serves to document agreement among major stakeholders, including senior management representing the operating owner (project proponent) and project management team organization (execution agency). FEL-2 also includes the facilities planning consultants or the department that helps the proponent define and streamline scope, prepare the project justifications and feasibility study, and develop the major design basis, cost, and schedule for the capital project under consideration. Major activities and deliverables during the conceptual stage (FEL-2) are shown in Figure 5.
Figure 5 – Major Activities and Deliverables During Conceptual Engineering (FEL-2)

Major activities during conceptual engineering include preparing the basis of design, performing a project feasibility study, issuing a preliminary Project Execution Plan (PEP), developing the Work Breakdown Structure (WBS), conducting value improvement practices including project and schedule risks, validating all viable alternatives, and identifying long-lead procurement items. Major deliverables during this phase include a design basis package, preliminary PEP, WBS, Level II project milestone schedule, Schedule Risk Analysis (SRA) report, and ±30% budget estimate.
5.1 Level II Project Milestone Schedule
During FEL-2, a detailed project milestone schedule is developed to plan and control the detailed activities required to produce all FEL-2 deliverables and ensure they meet milestone deadlines. The FEL-2 project milestone schedule should be a Critical Path Method (CPM) schedule and is customarily generated using computerized scheduling software such as Oracle Primavera® (P6) or MS Project®, with P6 being the preferred software for larger projects. A study comparing the two programs concluded, “After reviewing the differences between the two programs, it could be safe to say that Primavera P6 is perfectly suited for large-scale projects in industries such as Construction, Energy, and Aerospace. On the other hand, the simplicity of MS Project makes it most appropriate and convenient for some small-scale projects or people starting out as schedulers.”7
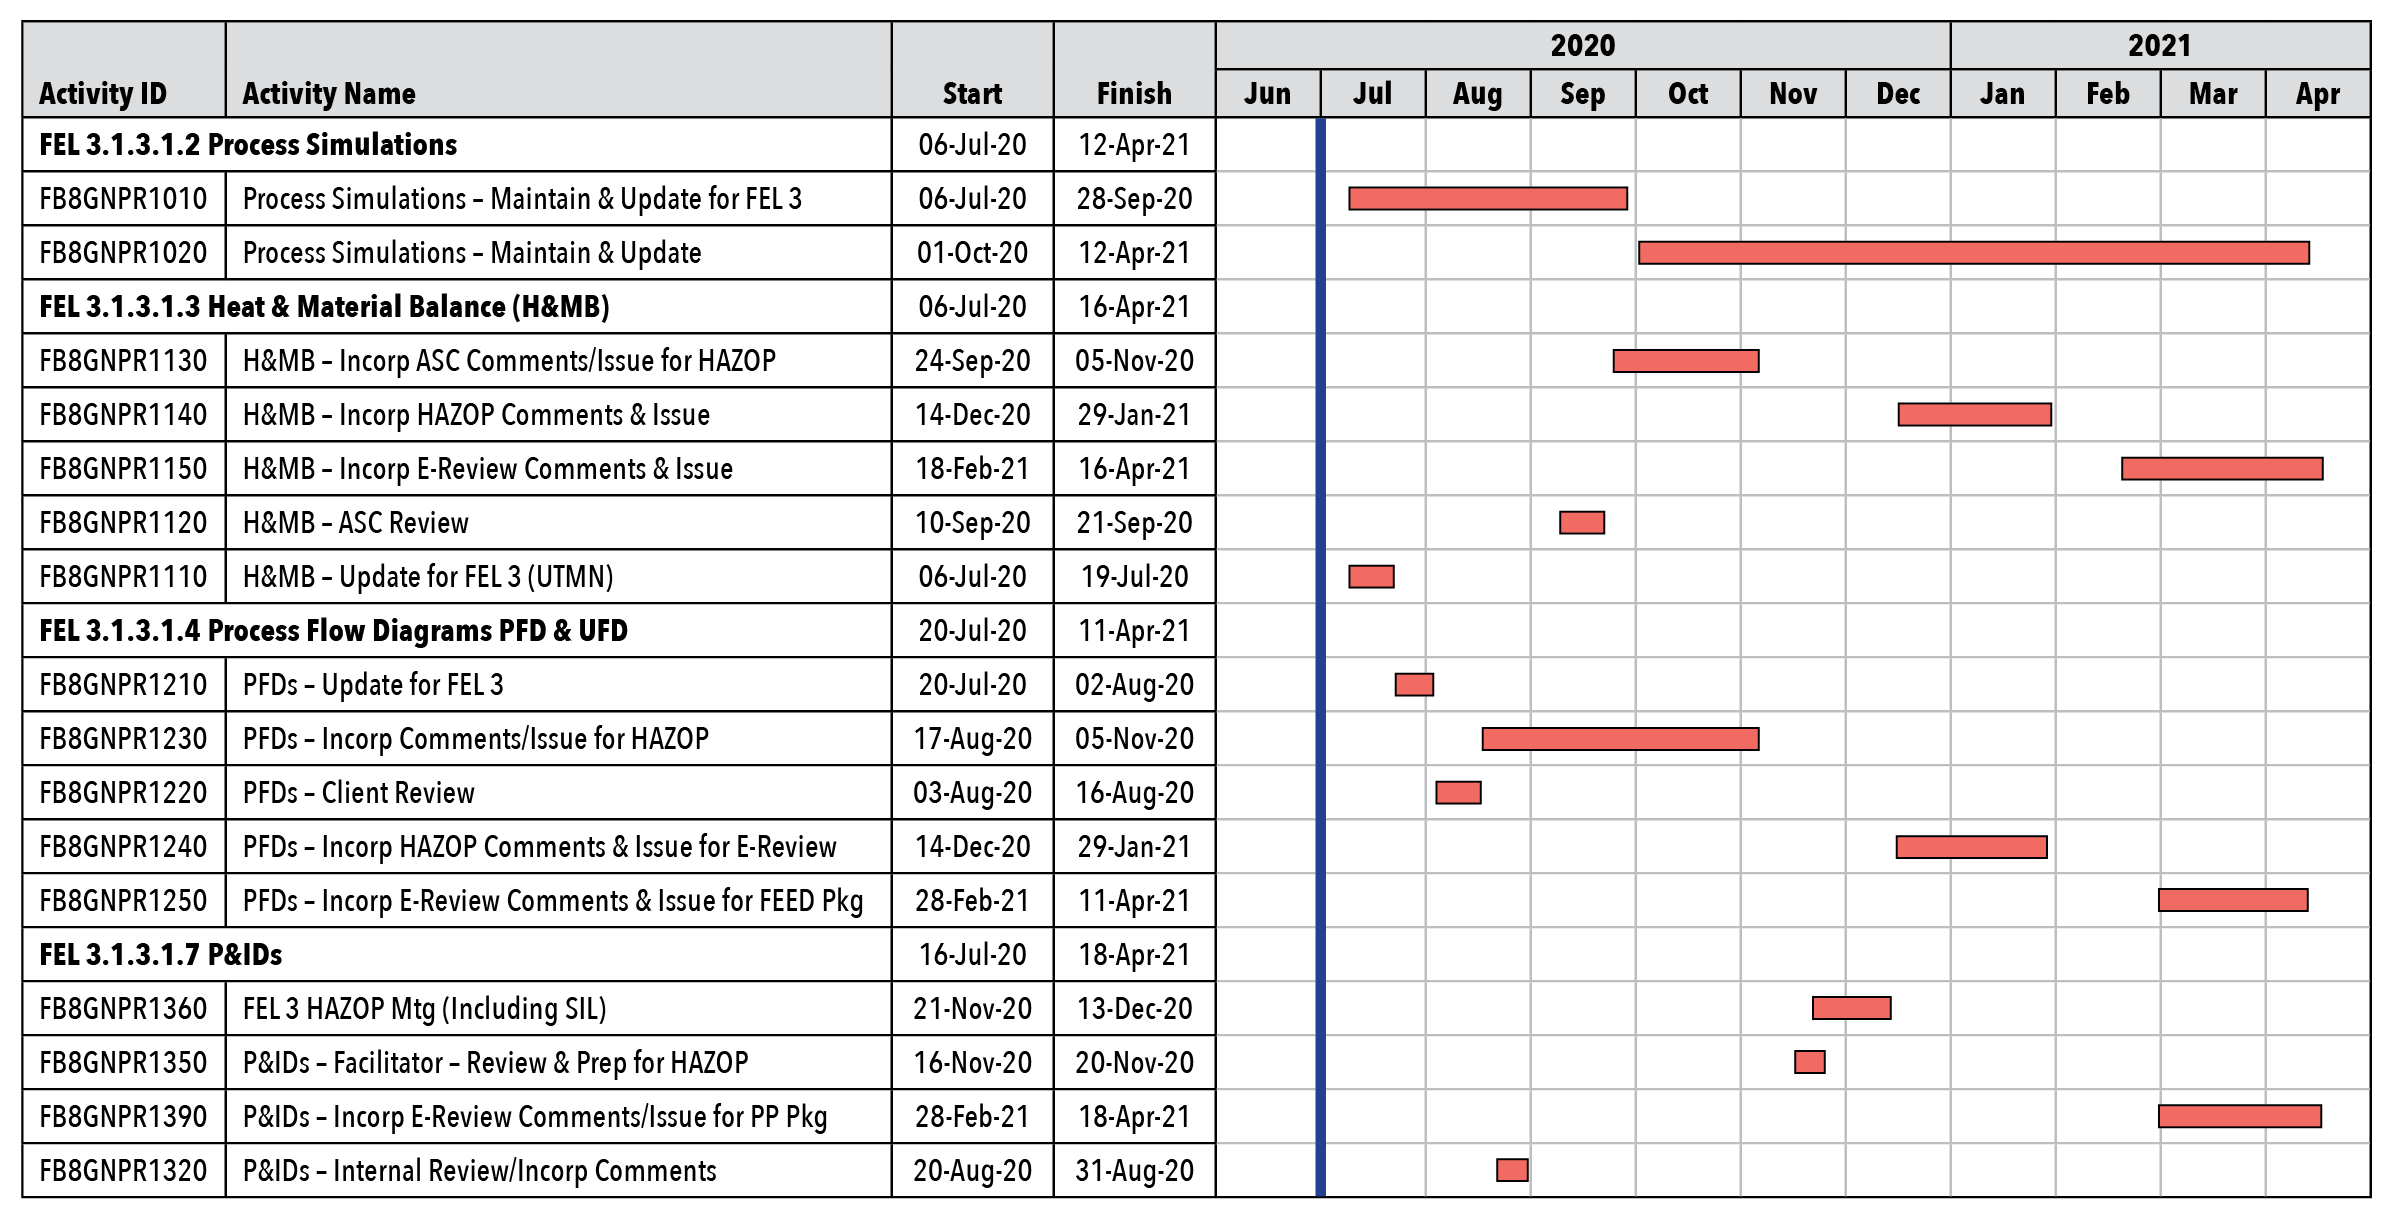
Interactive planning sessions are held during the development of this schedule to determine activity durations and logic to ensure that information from all disciplines and stakeholders is aligned and incorporated into the schedule. Schedule development is usually based on activities defined in discipline man-hour estimates. A project’s WBS organizes the project milestone schedule, and the timeframe is dictated according to the milestone constraints against the backward pass. Figure 6 shows an example FEL-2 schedule of engineering deliverables for process flow diagrams (PFD) and utility flow diagrams (UFD), as well as preliminary piping and instrumentation diagrams (P&IDs).
Figure 6 – Partial Example of a Level II Project Milestone Schedule
(Image Adapted from Oracle Primavera P6 Version 16.2)
The Level II schedule should be detailed enough to include activities addressing all major deliverables in each engineering discipline. It should include:
- A WBS to address all the proposed project scope including the types of facilities
- Land Use Permits (LUP) activities and milestones, including approval from relevant agencies
- Activities for the preliminary plot plan to show the location of proposed facilities
- Project interfaces between existing and proposed facilities as milestones
- High-level activities for drawings, documents, and specifications for each major discipline
- A detailed list of required equipment, including long-lead equipment
- Activities or milestones for economic evaluation/feasibility and other studies
- Preliminary environmental impacts assessment activities, including for the necessary agency approvals
- Required studies such as preliminary hazard analysis; initial Building Risk Assessment (BRA); Reliability, Availability and Maintainability (RAM) study; process simulation; environmental dispersions; etc.
- Activities for the energy optimization study, including PFDs and preliminary P&IDs
- All security-related studies and significant reports as deliverables
- A preliminary assessment of operational requirements, including safety requirements
- Activities for Value Improvement Practices (VIP) workshops, VIP studies, and VIP reports
- The preliminary PEP and the initial pre-commissioning and mechanical completion and commissioning/start-up plan
- Activities for the project closeout report/turnover
- Final approval by all parties at Gate 2. This assures that the project scope is complete and that all future changes will be compared against it.
The ultimate objective is to prepare a well-developed FEL-2 target schedule that provides a tool to measure the schedule/performance. In addition to the above, the project milestone schedule should accompany the following documents to review the schedule and easily provide quality checks. The following list provides the minimum quality measures one should include with the Level II project milestone schedule submittal:
- The basis and assumptions used to prepare the Level II project milestone schedule
- Complete “Design Basis” documents
- Updated project charter
- PEP
- Updated contracting strategy
- Updated project risk management or the risk register
- SRA report showing schedule confidence level
- Updated constructability review report
- Preliminary P&ID and other drawings, plot plans, and diagrams
- Procurement duration based upon actual vendor quotations
- Process and utility sized equipment list
- Sized electrical equipment list
- Bulk construction quantities
- Procurement strategy and material procurement plan
- Memorandum of understandings for execution (by others outside the organization)
- Commissioning, start-up, and shutdown requirements
- List of key interfaces
- Change log documenting project changes since start of FEL-2
- Benchmarking study or report
- Value assurance reports
6. QUALITY CHECKS DURING FEED DEVELOPMENT
The FEL-3 stage is project pre-planning, usually referred to as FEED. It focuses on technical project requirements with a definitive cost estimate of +/‒ 10% accuracy. To this end, all required FEED documents should be complete, such that the contracting strategy is final, bidding and award of the project execution are complete or in final stages, long-lead equipment vendors are selected or finalized, and all known potential risks are identified. Major activities and deliverables during FEL-3 are shown in Figure 7. This stage is typically followed by detailed design (or detailed engineering). It also includes special studies such as environmental studies and the hazard and operability study (HAZOP), Electrical Transient Analyzer Program (ETAP), energy optimization report, interface management, etc. Major deliverables include the final tender documents, Level III Project Summary Schedule (PSS), and detailed PEP. The FEED package as a deliverable of FEL‑3 is usually of sufficient detail to prepare a +/‒ 10% accuracy estimate used to secure authorization for permanent funding expenditure (AFE). It should also include sufficient technical information to obtain detailed EPC contract bids. FEED provides the baseline from which all subsequently considered scope changes are measured.
Figure 7 – Major Activities and Deliverables During FEED (FEL-3)

During the FEL-3 phase, several scheduling documents are produced that expand on the FEL-2 schedule to validate project timings and milestones. The Level II schedule is further broken down into more details showing resources such as man-hours, quantities, and production rates to facilitate the basis for calculating activity durations. The Level III schedule is used to evaluate schedules presented by the execution (EPC) bidders, serves as an interim schedule during project execution, and produces the expected project progress “S” curves and anticipated plan manpower histograms.
6.1 Level III Project Summary Schedule (PSS)
The Level III Project Summary Schedule (PSS) is a CPM-based schedule using P6 built on the information from FEL-2. The PSS is a fully resource-loaded schedule, and the activities for each phase are logically linked to produce a project’s overall duration and resource requirements. The Level III PSS provides the basis for key milestone dates and durations reflected in Issue for Bid Packages (IFB). Subsequently, critical milestones are extracted from this schedule and used as contractual milestones in the IFB of the execution (EPC) contract.
The Level III PSS establishes the baseline for project durations and represents the basis for project approval and total AFE funding. This schedule is used for generating project baseline progress “S” curves. The Level III PSS is an actual deliverable of FEL-3 and is rigorously reviewed at 60% development during the schedule optimization workshop discussed in Section 3.4. The following information in FEL-3 provides the required input and basis for Level III PSS preparation:
- FEED package at 60% development to start the Level III schedule
- FEED package at 90% development to complete the Level III schedule
- Final PEP
- Final contracting strategy
- Final constructability review
- Design drawings and diagrams Issued for Design (IFD)
- Sized equipment list for process, utility, and electrical
- Engineered and non-engineered material requisitions
- Vendor quotations on lead times
- List of long-lead items and fabrication/delivery data based on vendor quotations
- List of scope changes from approved FEL-2 with schedule impact
- Outcome of start-up plan workshop and commissioning and start-up requirements
- Shutdown sequence, required tie-ins, and hot tabs as needed
- Studies/reports such as market outlook, benchmarking, and schedule risk assessment
- WBS
- Schedule resource loading (see Section 3.2 below)
- Schedule basis and assumptions memorandum (see Section 3.3 below)
- Summary activities showing FEL-1, FEL-2, and FEL-3 with their latest statuses
- Detailed activities for engineering, procurement, construction, pre-commissioning, and startup
- Interface points across the packages as well as with other projects
- Activity durations should take into account direct engineering man-hours and productivity rates. The durations should also reflect the time required for all stakeholders to review and provide feedback for all the engineering documents and deliverables issued. Procurement durations are generally based on the most recent quotations. Durations for construction activities should be estimated using construction quantities, direct man-hours, and historical installation rates from similar types and sizes of projects. Construction activities should not exceed a 25-day duration in general unless justified.
- The schedule should also meet all the schedule quality checklists discussed in this paper.
6.2 Resource Loading the Level III Schedule
The Level III schedule should be resource-loaded at the activity level, not at a summary level, Level of Effort (LOE), or WBS summary level. Each of the activities for engineering, procurement, and construction are slightly different when it comes to allocating resources on Level III activities, as discussed below.
Engineering
Direct man-hours should be loaded on each engineering activity within the disciplines. Engineering resources are loaded based on level of effort. The engineering progress should be based on the number of deliverables issued. Engineering weightings can differ slightly based on project type and scope. Usually, engineering weightings are by the deliverables within each discipline. The sum of the weighted values of each activity in a given discipline should total 100%. Figure 8 presents an example of an engineering Progress Measurement System (PMS).
Figure 8 – Example of Engineering Progress Measurement System Weightings

Procurement
Procurement activities are usually developed using the following steps and weights. Typically, units of “each” are used for every purchase order or purchase requisition. The steps and weights may differ slightly based on company or project practices:
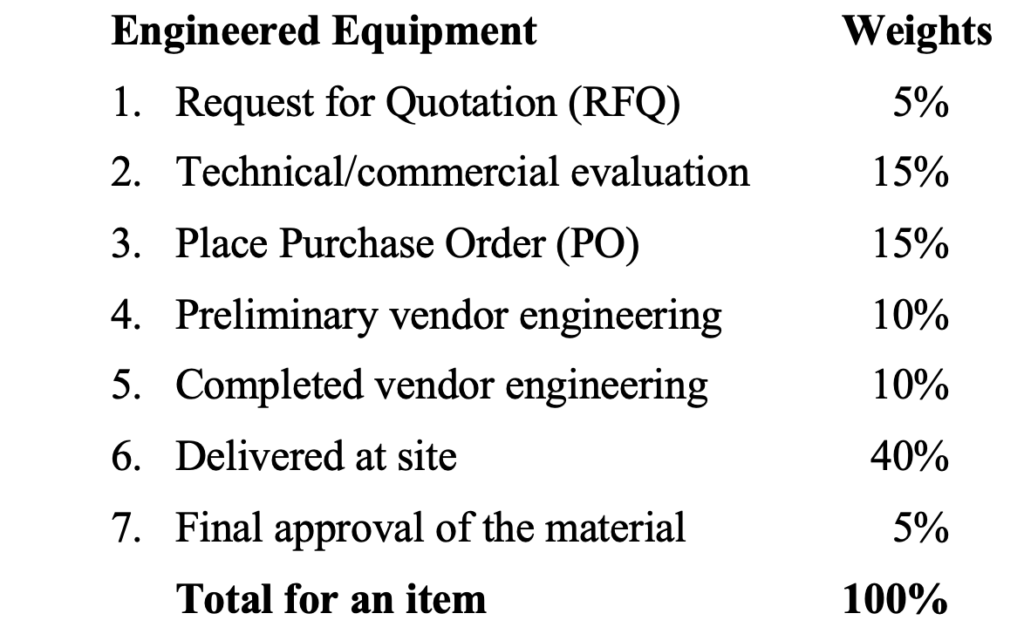
To produce the procurement “S” curves, each procurement activity should be resource-loaded using the above weightings. For example, a purchase order to procure transformers may be broken down into seven activities and assigned weights for each resource. The above weightings can be adjusted as applicable.
Construction
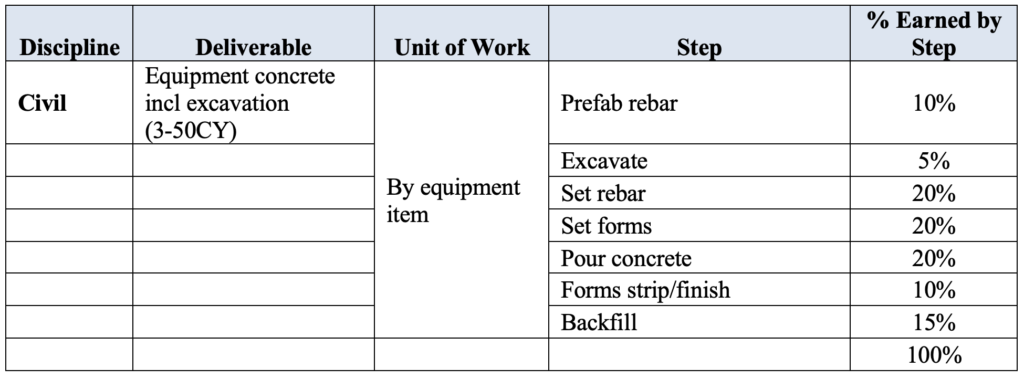
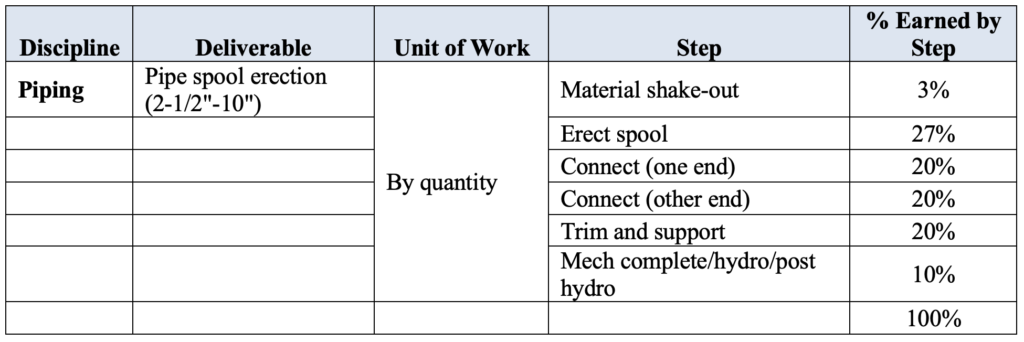
Construction activities are typically resource-loaded using direct labor man-hours. This represents the level of effort. Using cost as a resource instead of labor man-hours should be avoided as it will not present a realistic progress forecast (“S” curve). Although activities are resource-loaded using direct man-hours, progress is usually by units or quantities installed. Construction activity weightings vary for each discipline and type of project. The key is to design a balanced weighting system based on earned value, allowing reasonable progress without front-end loading the activities. Below are a few examples of PMS weightings or rule-of-credit and steps for different disciplines on an industrial project.
Figure 9 – Resource Loading Examples
Example of resource loading weights for structural steel:

Example of resource loading weights for civil:
Example of resource loading weights for piping:
Example of resource loading weights for mechanical equipment (exchangers):

Example of resource loading weights for electrical:

Example of resource loading weights for Instrumentation:

6.3 Schedule Basis and Assumptions Memorandum
The Level III PSS basis document should explain how the Level III PSS has been prepared. It should cover all aspects of schedule development, including structure, project scope, duration basis, inclusions, exclusions, assumptions, and risks associated with the project. The schedule basis and assumptions memorandum provides a narrative explanation of the project schedule and is the best platform to explain why any milestone dates are different from contract milestones. This document should include the following contents:
- Scope of work
- Schedule work breakdown structure
- Schedule activity code structure
- Schedule calendars
- Contractual milestones including any Liquidated Damages (LD) milestones
- Basis for duration calculations (key bulk quantities and production rates)
- Explanation of the critical and near-critical paths
- Resources including direct engineering and construction man-hours and key quantities
- Schedule risks and opportunities
- Exclusions
6.4 Schedule Optimization Workshops
The purposes of schedule optimization workshop(s) are to: achieve alignment by all project stakeholders on the overall schedule, establish priorities, understand manpower requirements, identify the basis for schedule activity durations, finalize the contracting and procurement strategies, identify internal and external constraints, etc. The pandemic has provided new opportunities for how to manage and communicate on projects. Subject matter experts (SMEs) including top-notch scheduling consultants can facilitate this workshop to assure the project schedule is sound and achievable. The schedule optimization workshop(s) should take place about 60% into FEL-3 to optimize the schedule for project completion. The workshop looks for the most realistic performance period for the project based upon historical experience and the capabilities of the service contractors and material suppliers. The schedule outcome from the workshop is to be used as a basis for validating schedules received from execution contractors during the bidding.
The ultimate objective of the schedule optimization is to establish a well-developed CPM Level III EPC schedule that will become the basis for a sound baseline and to report against this baseline during the execution phase. EPC schedule optimization utilizes schedule reduction and compression techniques to optimize the project schedule and use all the schedule quality checks highlighted in this paper. The deliverable of the workshop is a Level III baseline schedule that can serve to determine contractual milestone dates. It is also used to assess the completeness of the schedule submitted by bidders for the various contracts used during project execution. During the workshop, expert consultants or SMEs can professionally apply several quality checklists presented in this paper for optimum results. The quality checks include items in Sections 3.4.1 and 3.4.2 below.
6.5 Level III Schedule Document Quality Checklist
The following checklist identifies the minimum document quality assessments that should be included with a Level III PSS submittal:
- Level III PSS
- Basis of Level III PSS
- Final project charter
- Final PEP
- Final contracting strategy
- Updated project risk management
- Final constructability review report
- SRA report clearly showing schedule confidence level
- Process and utility sized equipment list
- Sized electrical equipment list
- Vendor quotations on lead equipment delivery times
- Engineering quantities and man-hours by discipline
- Construction quantities and man-hours by discipline or trade
- Procurement plan
- Commissioning and start-up requirements
- Benchmarking report
- Required shutdown windows
- Final agreed value assurance report
- Critical milestones issue for bid packages
6.6 Fourteen-Point CPM Schedule Assessment Check
The United States Defense Contract Management Agency (DCMA), formed in 2005, developed 14 rules as guidelines for evaluating schedule quality. These rules apply to checking the quality of any CPM-based schedule at any phase.8 These guidelines are not based on hard and fast rules but indicate potential problem areas requiring more rigorous review and analysis. Below is a summary of the 14-point schedule assessment checklist modified to be applicable to all schedule reviews, including Schedule Baselines for Control (SBC), as well as schedule updates and revisions. Fortunately, Primavera P6 EPPM includes the 14-point assessment checklist as a standard feature of Oracle Primavera.9
- Missing Logic: Is the schedule logic complete, without missing links? There should be only one activity without a predecessor and one without a successor. One should also ensure that the logic interfaces between engineering, procurement, construction, and any other interface are properly depicted.
- Negative Lags (Leads): Negative lags or “Lead Time” can cause scheduling problems and should not be used.
- Positive Lags: Positive lag durations greater than zero should be minimized. In general, the lag duration should be limited to less than two updated periods or 44 working days.
- Relationship Types: A CPM-based schedule gives the option of using four types of relationships: finish-to-start (FS), start-to-start (SS), finish-to-finish (FF), and start-to-finish (SF). The finish-to-start (FS) relationship is the norm. The SF relationship should not be used.
- Hard Constraints: Hard or mandatory constraints can affect the logic and can distort the critical path. Use of soft constraints such as “start or finish no later than” is necessary to reflect milestones beyond one’s control or interfaces from other packages. A good example is when a different contractor performs site preparation work and the site will not be available until that contractor finishes the work.
- High (Total) Float: DCMA defines high float as having a total float of 44 work days, which is two reporting periods (two months), or greater. High total float indicates that activities are not appropriately linked.
- Negative Float: Negative float in the schedule should not be accepted unless the parties recognize the project is not meeting a milestone or there is a problem with the planned work sequence and the parties agree to mitigate it. Regardless, negative float indicates that future critical dates will be missed unless the project team takes mitigation steps such as using fast track parallel EPC work or crashing the schedule by adding resources to the critical path activities.
- Long Durations: Schedules should reflect proper details within each WBS as part of decomposing work packages into smaller work scopes to have more discrete activities to track and manage the work. Use of long activity durations that are more than two reporting periods or 44 working days should be avoided unless explained and justified.
- Invalid Dates: An activity has invalid dates if it has forecast start and/or finish dates before the status cut-off date, or its actual start and/or finish dates are after the cut-off date, i.e., in the future.
- Resource Loading: It is highly recommended to resource load schedules. Resource loading helps to justify the basis for activity durations using production assumptions, facilitates producing estimated progress “S” curves directly from the schedule, allows for Earned Value (EV) progress analysis, enables the creation of manpower histograms in real-time based on schedule data, facilitates performing productivity analysis, and helps to document how a delay affected worker productivity, as well as other uses. Resource scheduling is a sign of a sound schedule. There are certainly exceptions where activities should not be resource loaded. For example, milestone activities, summary activities, level of efforts, activities with zero duration, procurement activities, etc., should not be resource loaded. On the rare occasion when man-hour data is not available, cost can be used for resource allocation. The use of cost loading should be limited to generating cash flow forecasting or project financial analysis.
- Late Activities: This metric measures performance against the baseline as a percentage of tasks planned to have finished as of the project status date, which have actual or forecast finish dates later than their baseline finish dates.
- Critical Path Test: This metrics with a pass/fail score tests the integrity or validity of the critical path. The DMCA test checks to ensure that introducing a delay into the schedule results in the project’s finish date being delayed by an equal amount. A failed result indicates missed dependencies or other factors affecting logic and requires deeper schedule analysis.
- Critical Path Length Index (CPLI): This index measures how realistic it is to complete the project on time. The calculation is defined as the sum of the remaining project duration and total float, divided by the remaining project duration. DCMA defines total float as the difference between the “late finish” date and the “early finish” date for project completion.
- Baseline Execution Index (BEI): The BEI measures performance against the baseline. This metrics is calculated by dividing the total number of tasks completed by the total number of tasks baselined to have been completed as of the project status date.
The 14-point assessment check is a helpful best-practice guide to assess the quality of a CPM schedule’s technical aspects. One can perform the checks manually or use the EPPM version of the software to produce it automatically. As these checks are becoming more a norm in the industry, more software is adopting them as an integral part of the program. Based on the above 14-point assessment check, populated with an actual example, the authors developed the 14‑point dashboard depicted in Figure 10. The dashboard presents actual scores for each of the 14-point assessment categories as compared with the target threshold. The challenge is to confine a project schedule to a purely numerical scoreboard particularly when planning is more of an art than science. Every project is unique and one must exercise judgment when applying the 14-point assessment check. The 14-point assessment metrics should not be used as a “one size fits all” concept. The authors developed a more flexible threshold providing four ranges of scores for each category. Take dashboard item 6, “Large Float,” for example. In order to meet the authors’ “target,” less than 1% of activities in a network should have total float of greater than 44 working days. However, if the project contains less than 5% of activities greater than 44 days total float, that would be considered to be meeting the DCMA minimum threshold recommended for high float. It is true that these guidelines may vary somewhat based on differing scheduling expert opinions, but they can be tailored for a specific project to account for special project requirements. As this is a management tool, managers should take an active role in setting the thresholds and revisiting them periodically and adjust them if needed.
The authors acknowledge that the intent of using the DCMA schedule metrics is to improve the quality of submitted schedules by adherence to predefined thresholds recognizing that there is no one common definition for all schedules and no one common metrics-based evaluation protocol.10
Figure 10 – Example of 14-Point Assessment Dashboard
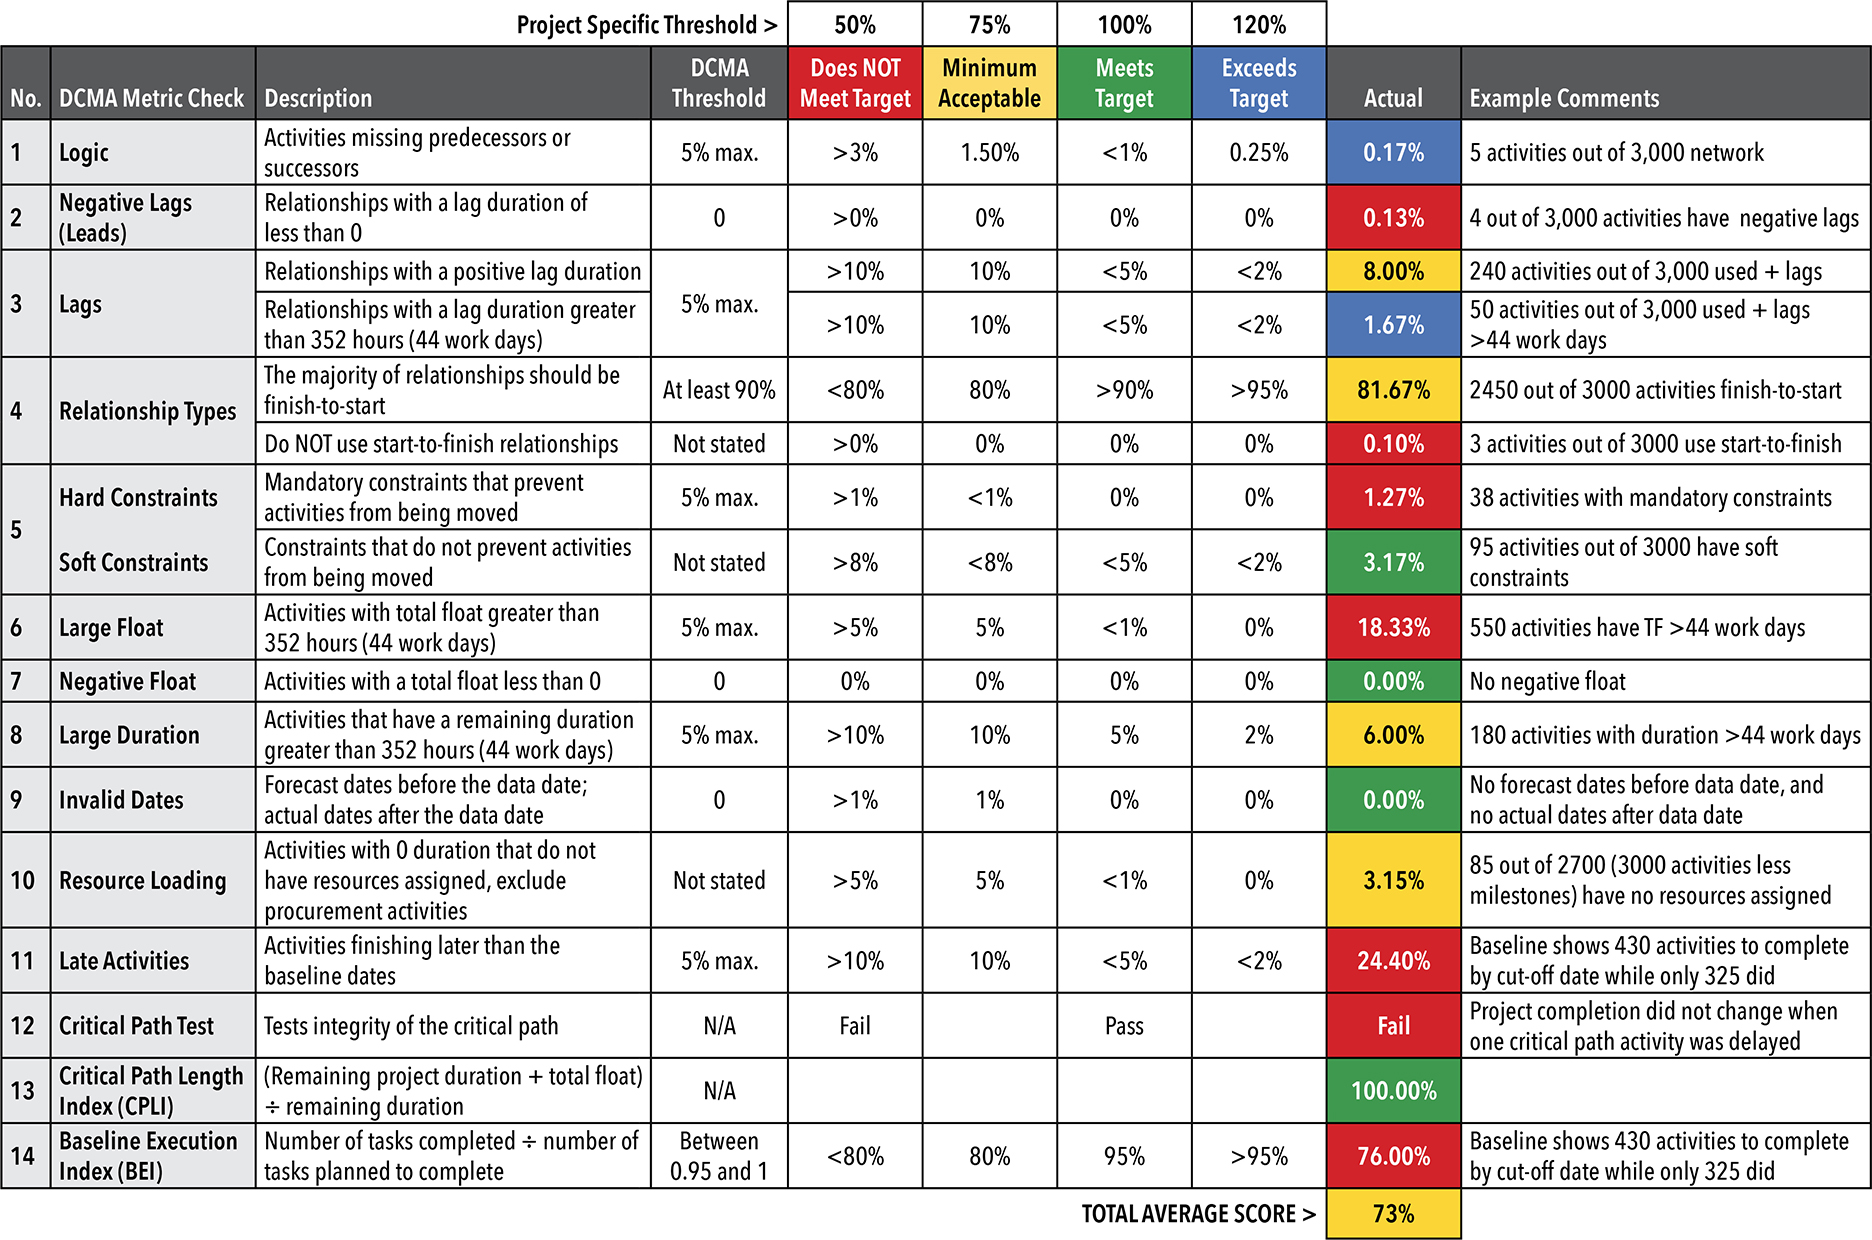
Use of the 14-point assessment provides an indication of the schedule trends and should be taken into account along with other factors such as whether: the schedule and WBS address the full scope of work; the activity duration bases are sound and reasonable; all contract milestones are included; and all contracting packages are reflected, as well as many other factors discussed earlier in this paper. Furthermore, just because certain metrics are scored as yellow or red does not necessarily mean the project is in trouble, but it is an indication that should be further examined with an opportunity for correction. It is much easier to highlight potential problems during the front-end planning than to deal with them during the execution. An important concept is that the early stages in the project life cycle can have a much greater influence on the project’s outcome than later stages.
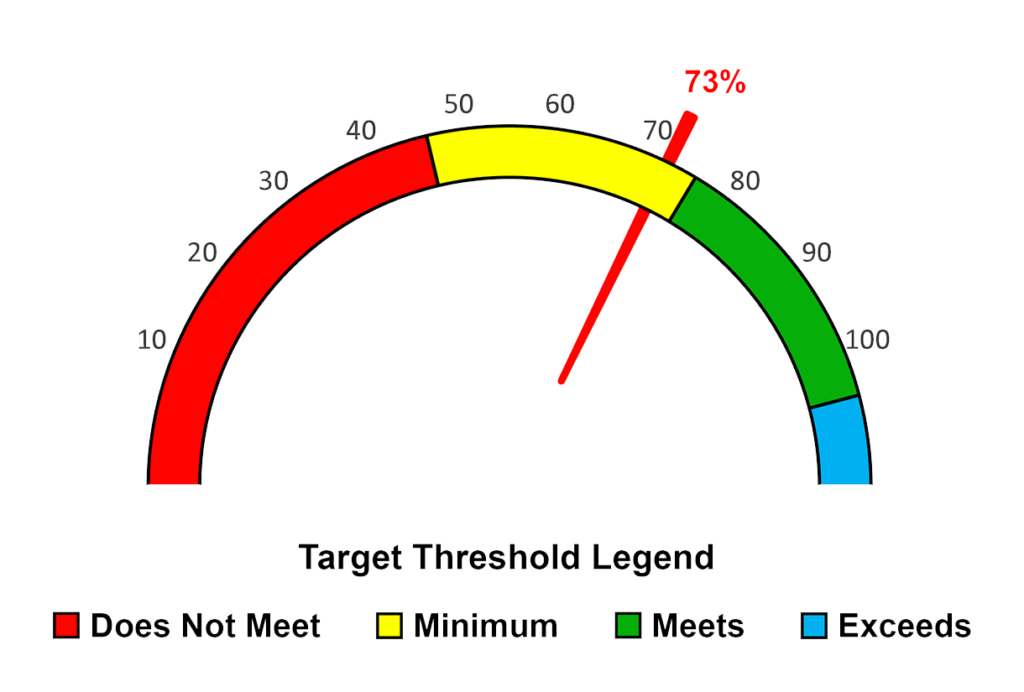
One of the questions management frequently asks when presented with any score board or key performance indexes is “What is the bottom line?” Therefore, the authors tallied the 14-point assessment scores above based on their values and weightings using the threshold percentage color scheme presented below in Figure 11 while treating each item as equal and calculated an overall project score relative to the schedule quality. Figure 11 shows an example overall project score of 73% in an Excel “gauge chart.” The example project dashboard gauge shows that the project schedule meets the minimum schedule quality requirement, but there is room for improvement to move the project into the green zone.
Figure 11 – Summary Results of 14-Point Assessment
7. CONCLUSION
This paper provides a guide for evaluating schedule quality during the important front-end planning of capital projects. The guides highlighted in this paper should be used as “leading indicators” for identifying potential problem areas before it is too late to take corrective action. The paper addresses: how one can achieve front-end optimization for schedules using the DCMA 14-point assessment as well as other quality review techniques to check if a project’s CPM schedule can be reasonably achieved; whether a schedule utilizes appropriate scheduling techniques; which schedule components should be analyzed to ensure quality; and how to measure quality within the schedule framework. The schedule quality assurance tools and FEED/FEL project management techniques presented in this paper are based on best front-end planning practices. The schedule quality guide outlined in this paper provides a comprehensive approach to effectively reviewing a project schedule and ensuring it is sound to serve as a robust baseline for managing a project during the execution phase.
About the Authors
Fred Rahbar, Ph.D., PMP, is CORE International Consulting’s Director responsible for Pro-Active Project Advisory Services. Dr. Fred Rahbar leads CORE’s Project Advisory Services in North America, Saudi Arabia, and throughout the Middle East. His 40+ years of experience include planning, scheduling, cost control, and hands-on experience developing, reviewing, and implementing claims mitigation procedures for all construction project phases for owners, consultants, and EPC contractors. Dr. Rahbar’s experience with international projects includes infrastructure, transportation, power, nuclear energy, wastewater, oil, gas, petrochemical, and other EPC projects. Dr. Rahbar provides cost and scheduling expertise in all phases of the construction project life cycle for a wide range of projects and litigations. He establishes accurate project durations for large-scale construction projects and proper project controls to track quantities, manpower, productivity, and much more. Dr. Rahbar is based near San Francisco, California, and can be contacted at frahbar@COREINTLCONSULTING.COM and (925) 451-4466.
Andrew Avalon, P.E., PSP, is Chairman and CEO of Long International, Inc. and has over 35 years of engineering, construction management, project management, and claims consulting experience. He is an expert in the preparation and evaluation of construction claims, insurance claims, schedule delay analysis, entitlement analysis, arbitration / litigation support and dispute resolution. He has prepared more than thirty CPM schedule delay analyses, written expert witness reports, and testified in deposition, mediation, and arbitration. In addition, Mr. Avalon has published numerous articles on the subjects of CPM schedule delay analysis and entitlement issues affecting construction claims and is a contributor to AACE® International’s Recommended Practice No. 29R-03 for Forensic Schedule Analysis. Mr. Avalon has U.S. and international experience in petrochemical, oil refining, commercial, educational, medical, correctional facility, transportation, dam, wharf, wastewater treatment, and coal and nuclear power projects. Mr. Avalon earned both a B.S., Mechanical Engineering, and a B.A., English, from Stanford University. Mr. Avalon is based in Orlando, Florida and can be contacted at aavalon@long-intl.com and (407) 445-0825.
REFERENCES
1 Avalon, Andrew, and Foster, Curtis W. “Schedule Quality Assurance Procedures,” AACE Transactions, Anaheim, California, 2010.
2 Shlopak, M.; Emblemsvåg, J.; and Oterhals, O. “Front End Loading as an Integral Part,” Proceedings IGLC-22, Oslo, Norway, June 2014.
3 Merrow, Edward W. “Oil and Gas Industry Megaprojects: Our Recent Track Record,” Journal of Petroleum Technology (JPT), p. 40, 23 March 2012.
4 Goldstrong, Vivien. “Microsoft Project Vs. Primavera P6: What are the Differences?,” ScheduleReaderTM, 18 April 2018.
5 Gibson, G. Edward; Dumont, Peter R.; and Griffith, A. “Pre-Project Planning Tools,” Construction Industry Institute, Annual Conference, Austin, Texas, 1995.
6 CII, “Support for Pre-Project Planning (Best Practice), RT-213 Topic Summary,” Construction Industry Institute (CII), Front End Planning Toolkit 2014.1 – IR213-2, Austin, Texas, November 2014.
7 Goldstrong. “Microsoft Project Vs. Primavera P6.”
8 Defense Contract Management Agency, “DCMA-EA PAM 200.1, Earned Value Management System (EVMS) Program Analysis Pamphlet (PAP),” Department of Defense, Washington, D.C., 2012.
9 Nasui, B., and Winter, R. “Scheduling Metrics and the Dangers of,” AACE Transaction PS-3642, Boston, 2021.
10 Ibid.
Copyright © Core International Consulting, LLC, and Long International, Inc.
ADDITIONAL RESOURCES

Articles
Articles by our engineering and construction claims experts cover topics ranging from acceleration to why claims occur.
MORE

Blog
Discover industry insights on construction disputes and claims, project management, risk analysis, and more.
MORE

Publications
We are committed to sharing industry knowledge through publication of our books and presentations.
MORE

